The U.S. hotel industry posted its highest nominal weekly average daily rate on record for the week ending September 19. CoStar reported average daily rate of $179.30, occupancy of 71.1 percent and revenue per available room of $127.43.
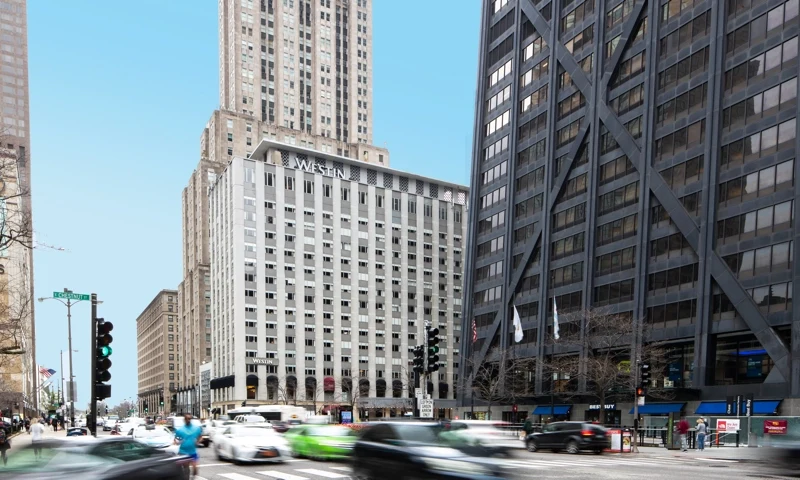
Chicago recorded the strongest gains in average rate and RevPAR among the top 25 markets, helped by the International Manufacturing Technology Show. Washington, D.C. posted the largest occupancy increase. CoStar also reported that 21 of the top 25 markets improved RevPAR year over year.
Hotel Business and Hospitality Net carried the same core performance data, while CoStar’s deeper analysis noted that group demand, events and broad rate growth all played a role. That matters to DJs, promoters and venue operators because large events do not only sell tickets. They change room demand, transportation patterns, restaurant traffic and staffing needs across a city.
For a promoter or hospitality operator, the practical opportunity is event-calendar intelligence. If a city is about to compress hotel inventory, pricing power can move fast.
THE DJ HANGOUT READ: use national hotel numbers as a signal, then drill into the actual city, event calendar, competitive set and customer mix before making a business decision.
WHY EVENT PROFESSIONALS SHOULD CARE
Hotel demand is one of the clearest secondary signals of major-event activity. Conventions, festivals and concerts can change room rates, restaurant traffic, transportation demand and staffing requirements across a city.
Promoters can read the same signal from the other direction. If hotel inventory is already compressed, the total cost of attending an event rises for traveling customers and the cost of housing touring crews may rise as well.
READ THE NUMBERS TOGETHER
Occupancy shows how much inventory is filled. ADR shows the average room rate. RevPAR combines rate and occupancy into a room-revenue measure. None of those figures, by itself, equals profit because labor, insurance, financing and other expenses still matter.
THE DJ HANGOUT READ
Use national hotel data as a signal, then drill into the exact city, dates, event calendar and competitive set. Hospitality intelligence becomes much more useful when it is local.
WHAT THE HOTEL NUMBERS CAN TELL AN EVENT BUSINESS
CoStar reported occupancy of 71.1 percent, average daily rate of $179.30 and RevPAR of $127.43 for the week ending September 19. Those measurements describe lodging demand, not concert demand, but they can reveal when a city is under unusual pressure.
For an event producer, compressed hotel inventory can raise crew and artist accommodation costs and make travel more expensive for fans. For restaurants, bars and transportation businesses, the same compression can signal an opportunity.
CITY-LEVEL CONTEXT MATTERS
Chicago’s strong rate and RevPAR growth was linked to the International Manufacturing Technology Show, while Washington, D.C. posted the largest occupancy increase among the top markets. One national number therefore hides very different local stories.
The DJ Hangout’s hospitality coverage will keep connecting macro data back to the city, event calendar and operating decision that a venue or promoter can actually use.
Strong event-driven demand can create pricing power and higher room revenue across major hotel markets.
National averages can hide weak individual markets and do not account for each property’s labor, debt and operating costs.